
System Identity
Identify the equipment, configuration and version being evaluated.
REPORTS — PERFORMANCE
Sustainable Oasis Performance Reports are designed to show how physical systems behave under defined operating conditions.
A performance report connects inputs, useful outputs, storage changes, losses, operating conditions and reliability.
The goal is not simply to produce an efficiency percentage.
The goal is to understand the complete system well enough to improve it.
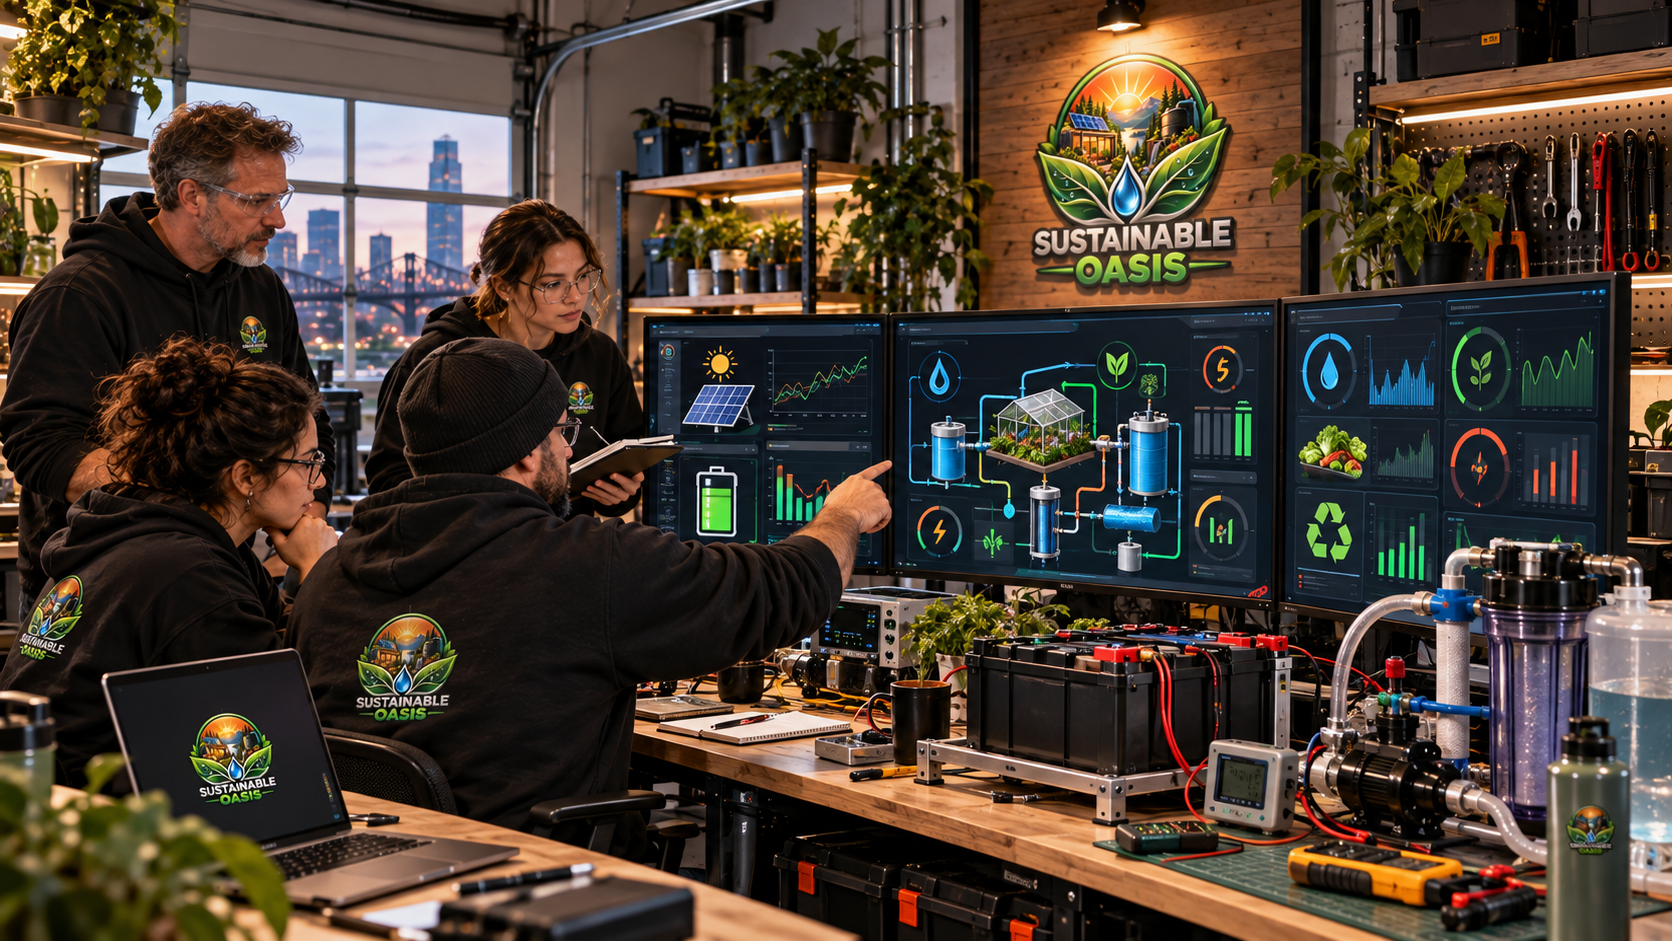
PERFORMANCE FIRST PRINCIPLE
Useful output matters, but performance also depends on what the system consumed, what remained in storage, what was lost and under which conditions the test occurred.
Sustainable Oasis should therefore avoid reporting isolated output numbers without the boundary needed to interpret them.
PERFORMANCE FRAMEWORK
PERFORMANCE REPORT STANDARD
Identify the equipment, configuration and version being evaluated.
Define what is included and excluded from the calculation.
Measure the resources entering the system.
Define and measure the service or resource the system is intended to provide.
Account for energy, water or material remaining in storage.
Identify conversion, distribution, thermal, friction and standby losses.
Record temperature, load, duration, weather and other relevant conditions.
Preserve faults, interruptions, resets and abnormal operation.
Explain what the observed performance means inside the defined boundary.
PERFORMANCE DATA CLASSIFICATION
Example values used for interface or educational purposes.
DEMOPerformance predicted from assumptions or models.
ESTIMATEDPerformance recorded from a physical system.
MEASUREDCalculations produced from documented source measurements.
DERIVEDENERGY PERFORMANCE
Energy performance reporting should include generation, external supply, battery changes, useful loads, recovered energy and documented losses.
Auxiliary systems matter too.
Chargers, converters, controllers, pumps, cooling systems and standby loads can significantly influence the final balance.
ENERGY IN = USEFUL OUTPUT + STORAGE CHANGE + LOSSES
EFFICIENCY
Sustainable Oasis should define exactly which measured input and useful output are being compared.
EFFICIENCY = USEFUL ENERGY OUTPUT ÷ MEASURED ENERGY INPUT × 100
A subsystem efficiency should not be presented as whole-system efficiency.
The report should always identify the boundary associated with the percentage.
ENERGY RECOVERY PERFORMANCE
Regenerative braking, micro-hydro, thermal recovery and other recovery systems may improve overall efficiency.
Recovered energy already originated somewhere inside the larger energy system.
It should not be treated as an independent source of newly created energy.
SO-EMS PERFORMANCE REPORTING
The Sustainable Oasis Energy Management System provides a foundation for measuring energy through experimental systems.
M01 begins with voltage, current, power and watt-hour measurement.
Later system-level reporting can build on that foundation without losing the underlying physical measurements.
WATER PERFORMANCE
A water system can appear functional while still consuming unnecessary pumping energy, losing pressure or wasting stored water.
Performance reporting should connect source, storage, pressure, flow, pumping energy and actual demand.
Water recovery and reuse should remain separate from new water entering the system boundary.
GRAVITY WATER PERFORMANCE
Gravity-fed water systems should document vertical head, pipe dimensions, fittings, pressure and delivered flow.
Available static pressure is strongly related to vertical elevation difference, while real flow is reduced by friction and component losses.
Field measurements should be compared with design calculations to improve future systems.
FOOD PERFORMANCE
Sustainable Oasis food systems can be evaluated using production, area, water, energy and growing duration.
PRODUCTIVITY = HARVEST ÷ GROWING AREA
Water intensity and energy intensity can reveal differences that harvest weight alone cannot show.
INFRASTRUCTURE PERFORMANCE
How often was the system available when needed?
Which components stopped performing as intended?
How long did diagnosis and restoration take?
What preventive work was required to preserve performance?
What is the current state of the asset?
Can components be accessed, diagnosed and replaced realistically?
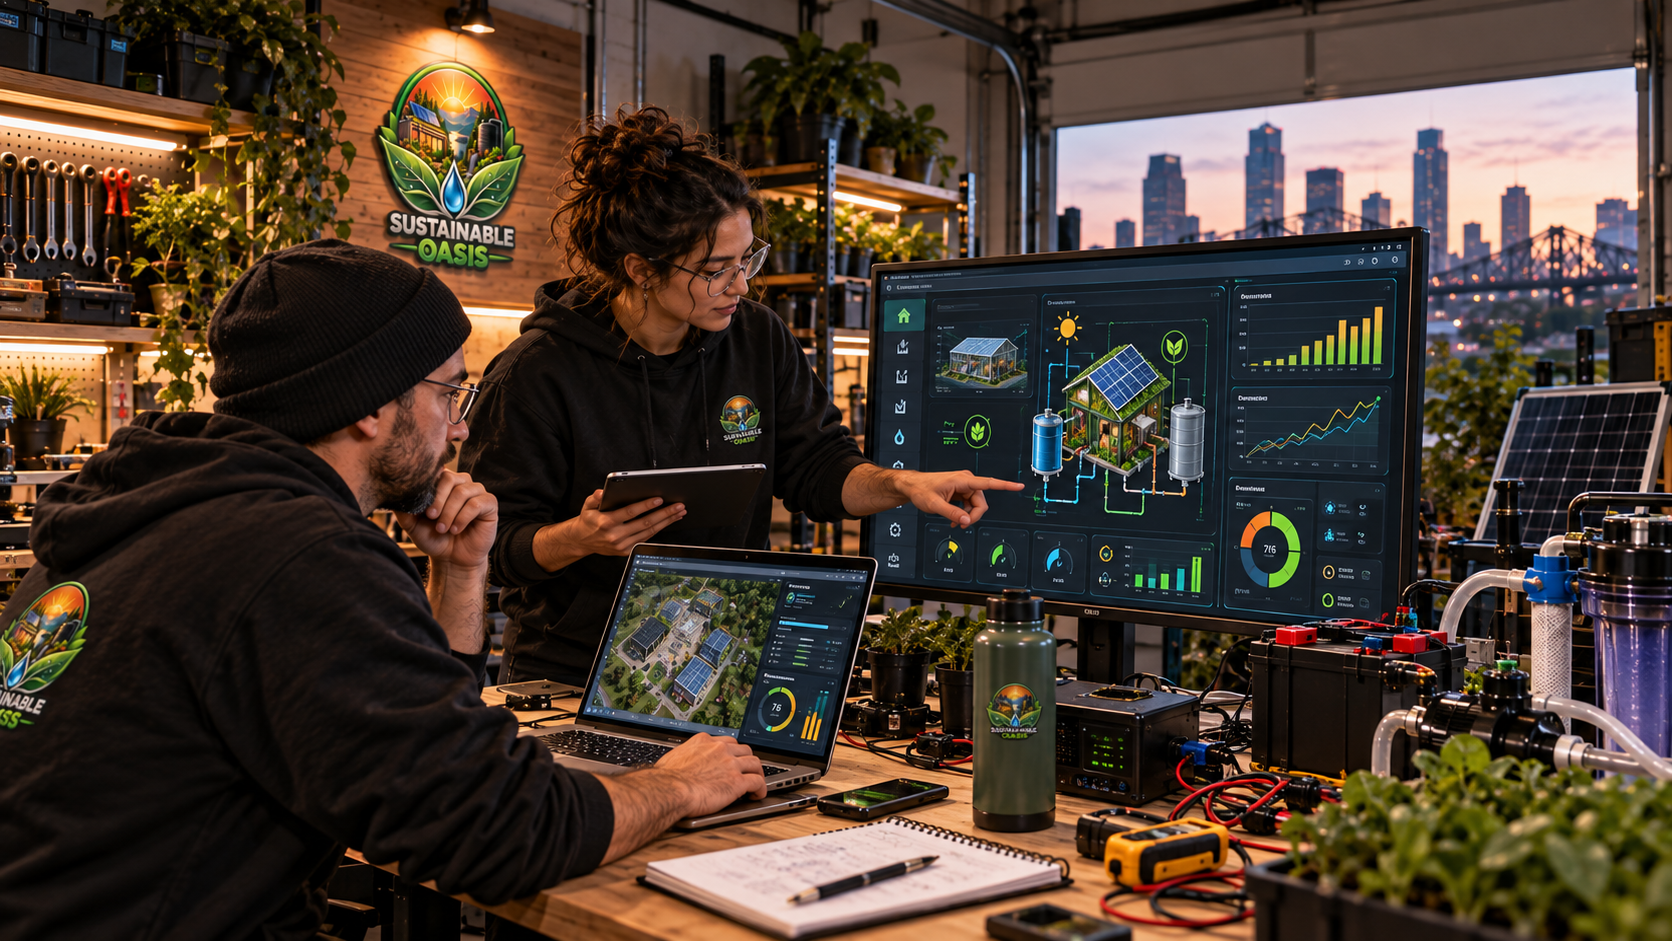
AUTOMATION PERFORMANCE
Automation performance should verify whether the requested action actually occurred.
A controller may command a valve to open, but the system should verify the resulting state using appropriate feedback.
AUTOMATION METRICS
How long between detection, decision and physical action?
How closely does the reading correspond to the reference?
What happens when a sensor or actuator fails?
Does the system move toward an appropriate safe condition?
Can essential functions still be operated locally?
STORAGE PERFORMANCE
Batteries, water tanks, thermal stores and other storage systems should be evaluated using both capacity and recoverable output.
Storage performance can include charge or fill input, storage duration, standby losses, usable output and remaining stored resource.
For an energy store:
ROUND-TRIP EFFICIENCY = ENERGY RECOVERED ÷ ENERGY INJECTED × 100
OPERATING CONDITIONS
Record the demand placed on the system.
Thermal conditions can influence equipment and storage performance.
Short tests and long-duration operation may produce different results.
Weather, humidity, terrain or water conditions may matter.
Identify startup, steady state, charging, recovery or standby operation.
PERFORMANCE OVER TIME
Time-series data can reveal startup behavior, cycling, peaks, temperature effects, storage depletion and intermittent faults.
Sustainable Oasis performance reporting should preserve timestamps whenever the evolution of the system matters.
BASELINE COMPARISON
Performance improvements should be compared against a documented baseline whenever practical.
The baseline and modified system should use comparable boundaries, units and operating conditions.
If conditions differ substantially, the report should explain why the comparison may be limited.
MEASUREMENT UNCERTAINTY
Sensor accuracy, meter resolution, calibration, sampling rate and environmental conditions can all affect the result.
Derived performance metrics inherit uncertainty from the measurements used to calculate them.
Reporting these limits makes performance conclusions more useful, not less.
REPEATABILITY
LAB PERFORMANCE → FIELD PERFORMANCE
Laboratory conditions help isolate variables and improve repeatability.
Field conditions introduce weather, dirt, temperature variation, long cable runs, terrain, maintenance and human behavior.
Sustainable Oasis should therefore label clearly whether performance results come from laboratory or field operation.
PERFORMANCE BY PROJECT
Controlled system testing, measurement benches and performance comparisons.
Garage Lab →Compact infrastructure, operating loads, serviceability and real installation constraints.
Container Workshop →Water, gravity, food, renewable energy and field-system performance.
Vietnam Oasis →Future mobility, energy-per-distance, terrain and stationary-autonomy performance.
Mobile Oasis →Combined performance across energy, water, food, infrastructure and economics.
Complete Oasis →COMPLETE OASIS PERFORMANCE
CONTROL ROOM → PERFORMANCE
The Sustainable Oasis Control Room provides a digital layer for organizing energy, water, food, infrastructure and impact information.
Performance reports can eventually draw from structured operational records rather than reconstructed memory.
Real sensor integration should only be presented when real sensors and validated data pipelines exist.
PERFORMANCE DATA PIPELINE
PERFORMANCE FAILURES
A system may work but slowly degrade because of fouling, battery aging, filter restriction, pump wear, corrosion or changing environmental conditions.
Performance reports should preserve these changes rather than report only the best operating point.
Understanding deterioration helps improve maintenance planning and system design.
SAFETY + PERFORMANCE
Electrical systems, batteries, rotating equipment, pumps, pressure systems, thermal systems and moving machinery all operate inside safety limits.
Performance testing should not bypass protective devices or safe operating limits merely to obtain a higher output number.
Batteries can deliver very high fault current even at relatively low voltage.
Mains electrical work and other regulated systems may require qualified professionals.
PERFORMANCE → SUSTAINABILITY
Performance reporting tells us how efficiently and reliably a system operates.
Sustainability reporting asks whether those changes reduce resource demand, protect water, reduce waste or increase resilience.
The two report types should remain connected without becoming interchangeable.
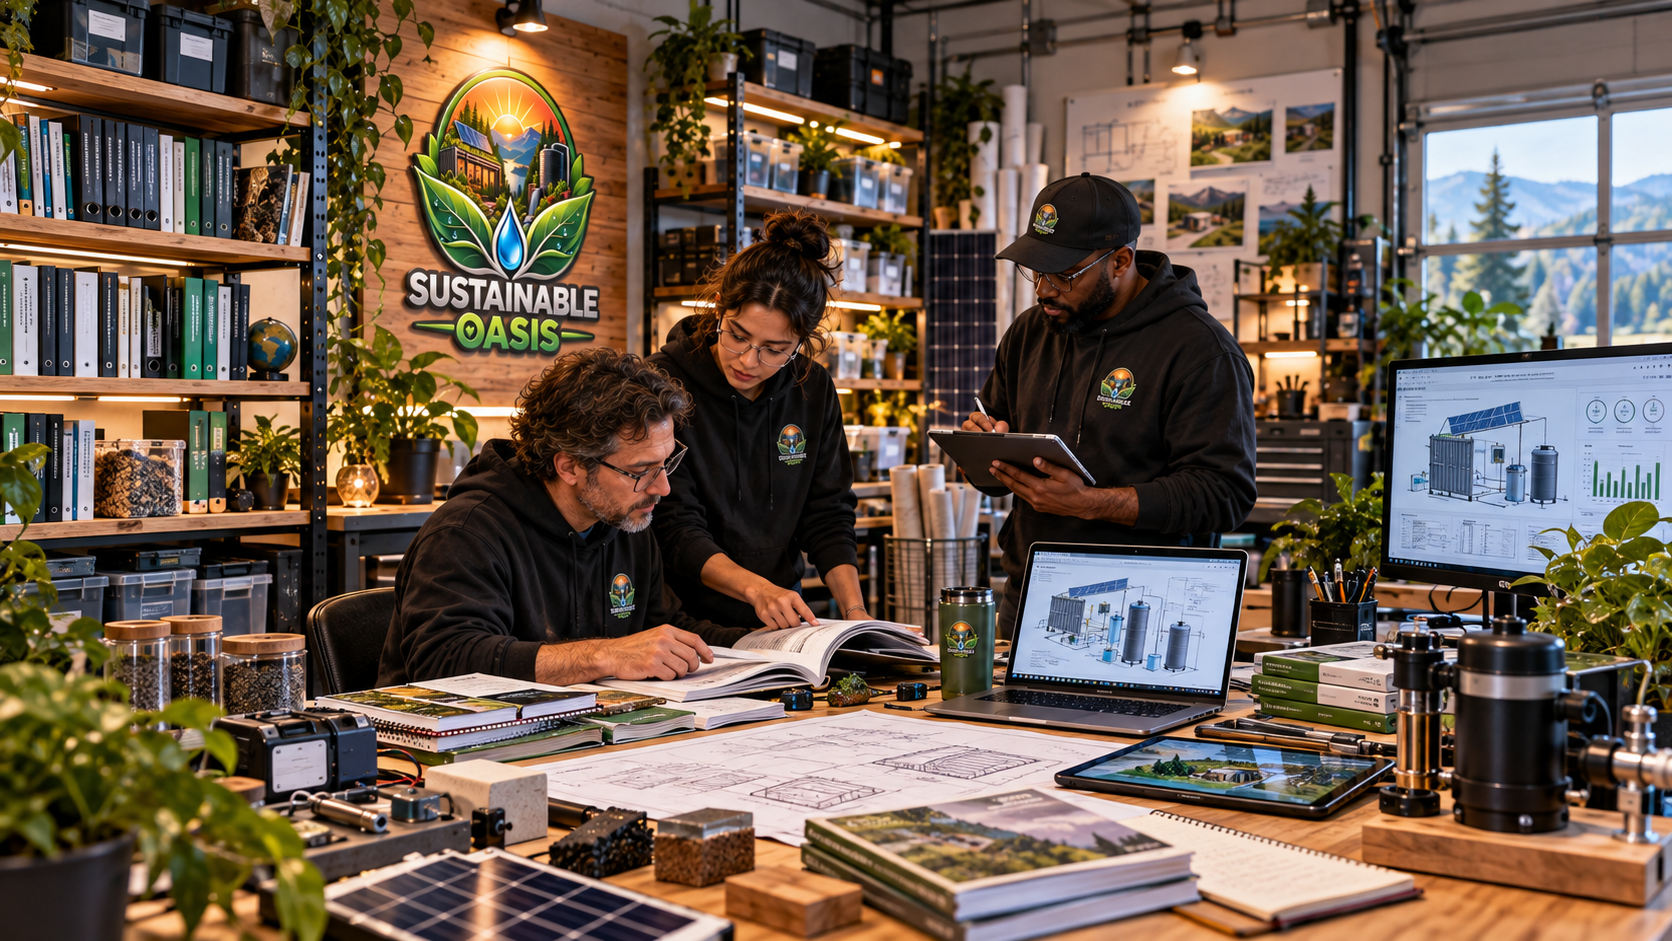
PERFORMANCE → KNOWLEDGE
Mature performance reports can become guides, case studies, maintenance recommendations and blueprint improvements.
The report preserves the measured system behavior.
The Knowledge Base converts those lessons into information that can support future builds.
PERFORMANCE REPORT VERSIONING
Permanent reference for the report.
Identify the physical configuration that was tested.
Define when the measurements were collected.
Connect the report to supporting measurements.
Preserve revisions to calculations or interpretation.
Document uncertainty, exclusions and incomplete data.
FUTURE PERFORMANCE DOWNLOADS
Mature performance studies may eventually be released as versioned PDF reports with supporting datasets and worksheets.
Until then, Sustainable Oasis Online can preserve the reporting architecture without claiming fictional completed reports.
PERFORMANCE REPORT PRINCIPLES
Know exactly what is being measured.
Do not evaluate output without knowing what entered the system.
Stored resources can hide apparent gains or losses.
Performance depends on how and where the system operated.
Reliable performance should survive repeated testing.
OUR NORTH STAR
Sustainable Oasis does not need the highest possible output at any cost.
We need systems that are efficient, understandable, resilient, repairable and appropriate for the resources available.
IN THE FUTURE, SUCCESS WILL NOT BE MEASURED BY WHAT WE HAVE, BUT BY WHAT WE PROTECT.
SUSTAINABLE OASIS REPORTS
Questions, methods, measurements, results and replication.
Experiment Reports →Inputs, outputs, storage changes, losses and system performance.
Performance Reports →Resource demand, recovery, resilience and baseline comparison.
Sustainability Reports →Yearly progress across projects, research, economics and knowledge.
Annual Report →PERFORMANCE LEARNING LOOP
PERFORMANCE REPORTS