
SUSTAINABLE OASIS ONLINE
Control Room
One operating view for energy, storage, water, food, recovery and system efficiency.
Planning assumptions and real measurements remain visibly separated so the Oasis can learn from the difference.
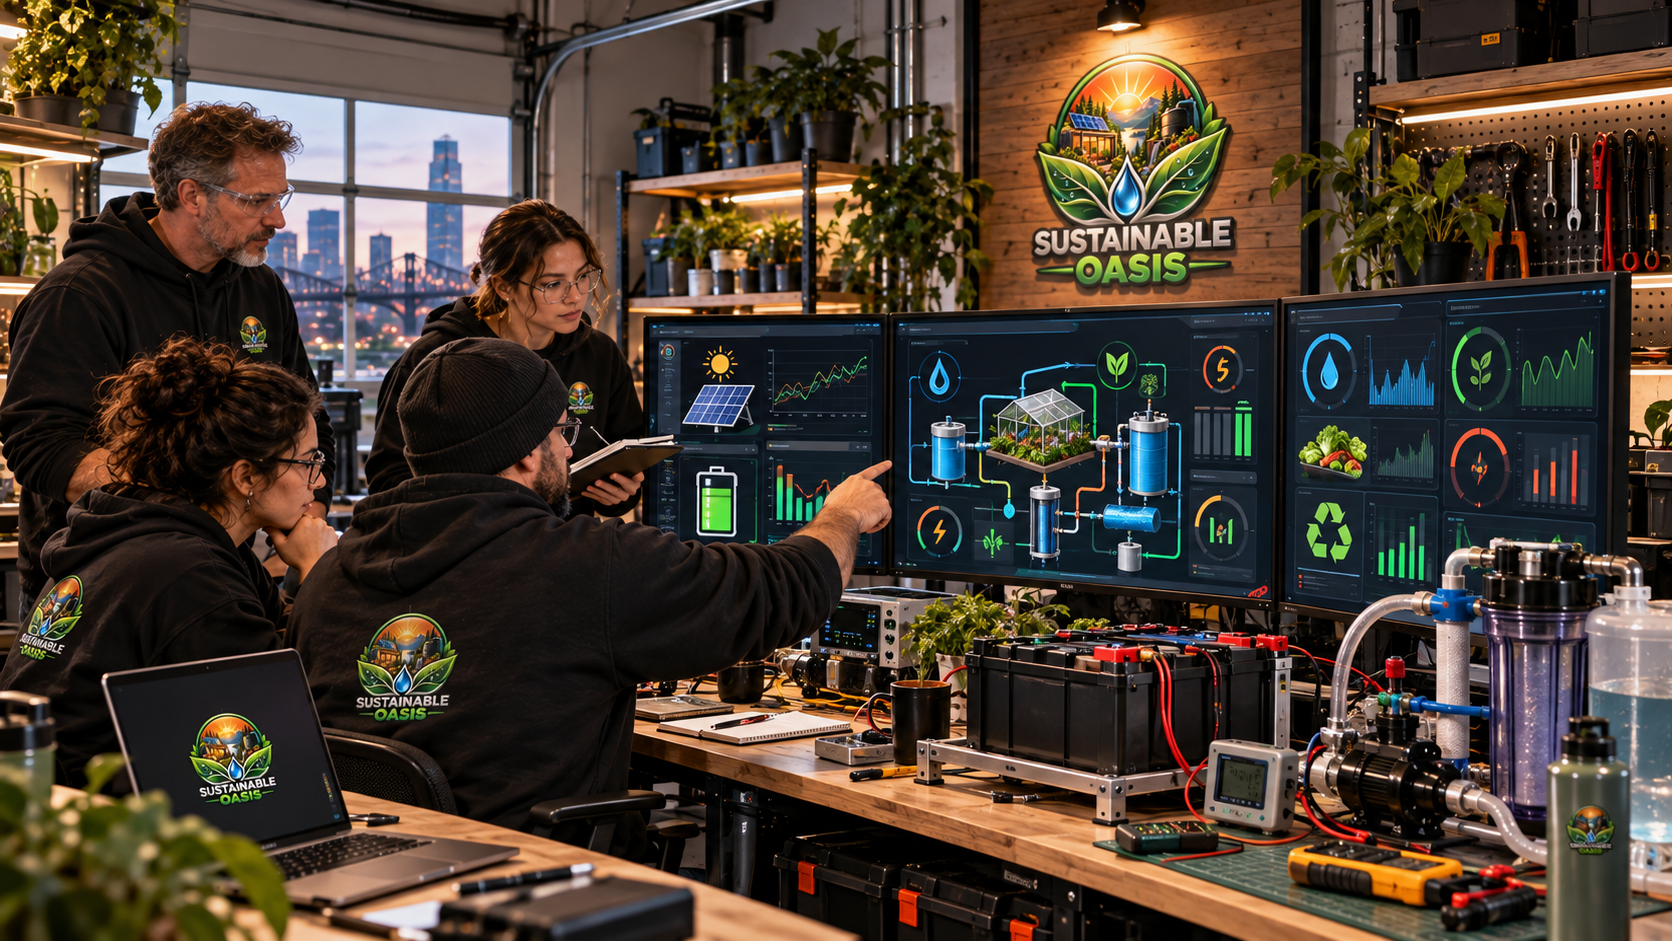
THE OPERATING LOOP
Turn assumptions into evidence.
The Control Room connects planning, physical systems, experiments and measurements into one learning loop.
ESTIMATE
BUILD
MEASURE
COMPARE
IMPROVE
REPLICATE
OASIS STATUS
Living Systems Overview
DEMO DATA
Current default values are demonstration data. Future values may be imported, estimated or measured through Sustainable Oasis systems and SO-EMS.
DATA CLASSIFICATION
A number is only useful when we know what it represents.
Demonstration
Example values used to demonstrate interfaces, calculations and future workflows.
DEMOEstimated
Planning values based on assumptions, calculators or incomplete information.
ESTIMATEDMeasured
Values collected through documented physical measurement or validated instrumentation.
MEASUREDDerived
Values calculated from known measurements using a documented equation.
DERIVEDENERGY
Generation, consumption and recovery.
Energy resilience begins with understanding every meaningful flow rather than simply counting installed equipment.
— kWh
Renewable or experimental energy entering the tracked system.
—— kWh
Electrical energy consumed by Oasis loads.
— kWh
Energy recovered from regenerative or reuse pathways.
— %
Recovered energy relative to tracked consumption.
STORAGE
Resilience lives between supply and demand.
Storage lets a system shift useful resources through time instead of requiring production and demand to occur simultaneously.
— kWh
Electrical energy currently represented as stored.
—— kWh
Known nominal or usable battery capacity when supplied.
— L
Water currently available in tanks or reservoirs.
— %
Storage utilization when total battery capacity is known.
WATER
Capture. Store. Filter. Use. Recover.
A resilient water system needs visibility across collection, treatment, storage, consumption and reuse.
— L
Water entering the Oasis collection system.
—— L
Water processed through tracked filtration.
— L
Water reused instead of immediately discharged.
— L
Tracked or estimated water demand.
FOOD
Measure the harvest and the resources behind it.
Food production becomes more useful when yield is connected to area, water and operating resources.
— kg
Recorded or estimated food production.
—— m²
Active area supporting tracked production.
— L
Water associated with the selected production period.
—
Kilograms produced per 1,000 litres of tracked water.
RECOVERY
Waste less by cycling resources longer.
Recovery metrics identify resources that can be captured or reused before additional energy or water must enter the system.
— kWh
Energy returned or recovered through tracked systems.
— L
Water recovered for suitable reuse.
ENERGY ACCOUNTING
Recovery reduces waste. It does not create energy.
Recovered energy remains part of the complete system balance and must not be counted twice.
Motors, pumps, chargers, converters, compressors, controls and storage changes belong inside the system boundary whenever they contribute to the experiment.
EFFICIENCY
Turn raw measurements into useful comparisons.
— %
Dashboard tracking indicator for useful energy flows.
— %
Energy recovery relative to tracked consumption.
— %
Collected water represented as reused water.
—
Kilograms of food per 1,000 litres of tracked water.
DATA PIPELINE
From physical measurement to useful intelligence.
SENSOR
METER
LOGGER
DATASET
CONTROL ROOM
DECISION
DATA CONTROL
Export. Import. Compare.
The Control Room state can be exported as JSON for documentation, experiments, backups and future data pipelines.
Imported datasets can become the bridge between manual experiments, sensors and SO-EMS.
SO-EMS + CONTROL ROOM
Measurement is the bridge between the laboratory and the dashboard.
SO-EMS is being developed to measure energy flows across sources, routing, storage, loads and recovery.
The Control Room organizes those measurements so experiments can be compared over time.
- M01 measures energy
- M02 manages routing
- M03 characterizes storage
- Data becomes a structured record
- Control Room organizes the result
CONTROL ROOM
DIGITAL
INTELLIGENCE
INTELLIGENCE
SOURCE
STORAGE
LOAD
RECOVERY
FROM PLANNING TO PROOF
Feed the Control Room.
Sustainable Oasis tools create planning estimates. SO-EMS and field measurements can progressively replace assumptions with measured evidence.
Oasis Planner
Configure energy, storage, water and food together.
Open Oasis Planner →Solar + Battery
Model generation, storage and estimated autonomy.
Open Energy Tools →Collection + Autonomy
Estimate incoming water and stored-water resilience.
Open Water Tools →SO-EMS
Build the measurement layer behind real energy experiments.
Enter SO-EMS →COMPLETE OASIS
One Control Room. Many physical systems.
The long-term goal is to understand the complete relationship between the systems that make an Oasis resilient and productive.
ENERGY
WATER
FOOD
SHELTER
AUTOMATION
CONTROL ROOM
CONTROL ROOM PRINCIPLE
A dashboard should never make an estimate look measured.
Sustainable Oasis keeps planning values, demonstration values and physical measurements visibly distinguishable.
As real instrumentation comes online, measured values can progressively replace planning assumptions.
THE OPERATING LOOP