Experiment Reports
Questions, hypotheses, procedures, measurements, results and conclusions.
Experiment Reports →DOWNLOADS — REPORTS
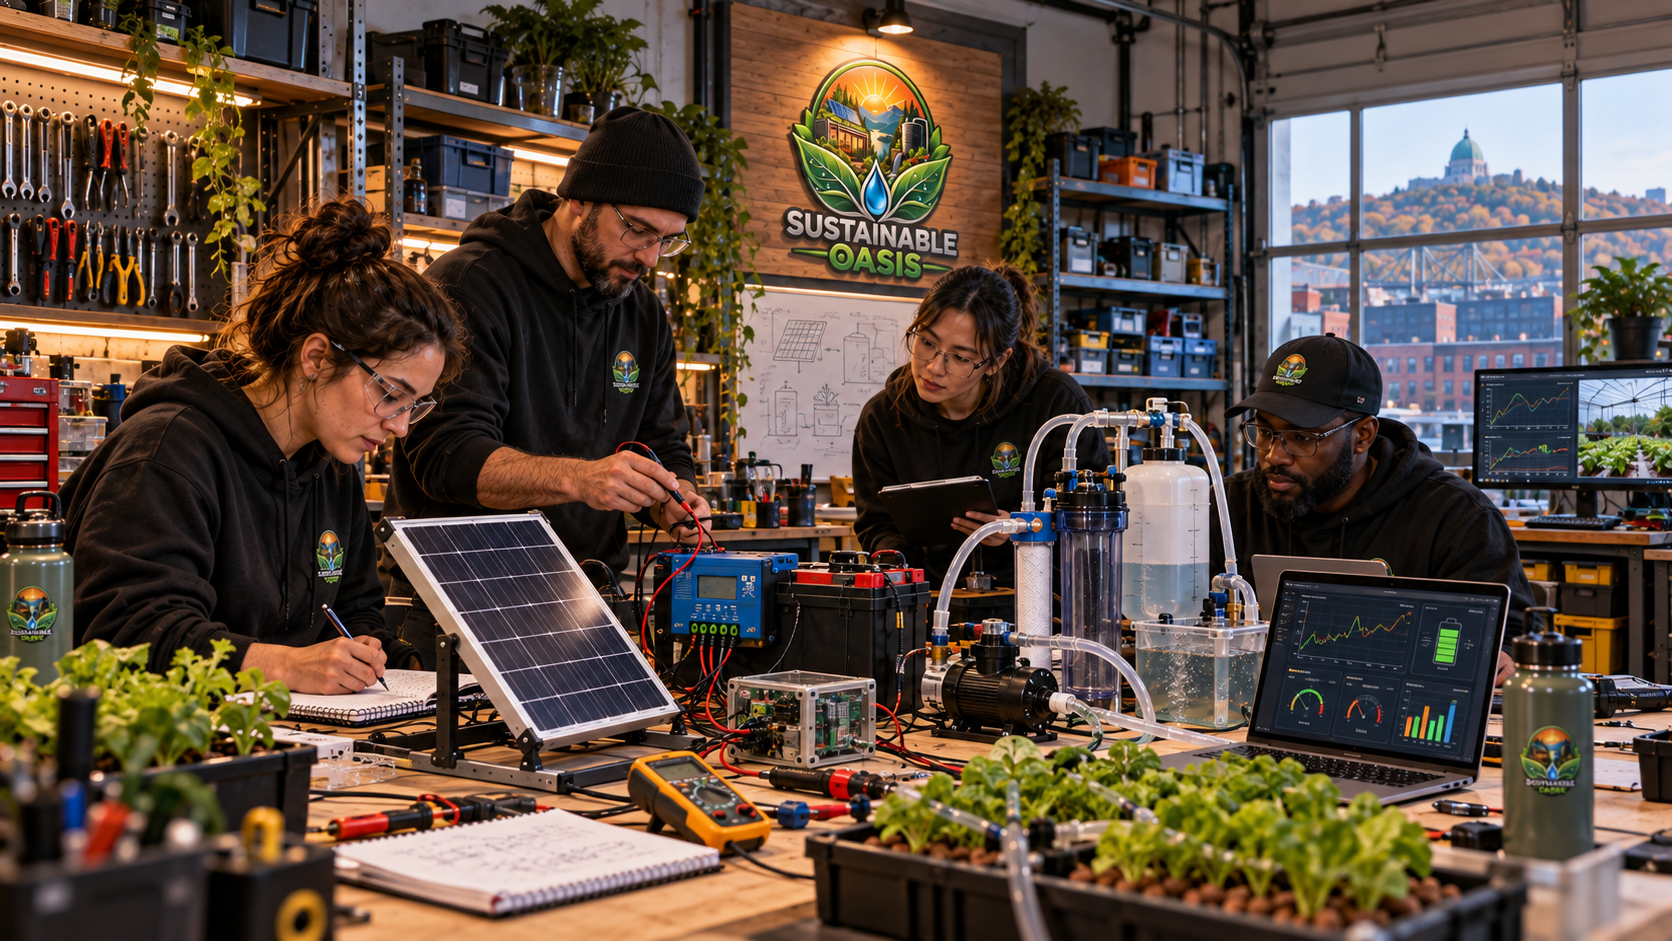
Sustainable Oasis reports will document experiments, system performance, sustainability indicators, field observations and long-term progress.
A useful report should preserve the question, system boundary, evidence, method, results, limitations and next steps.
Downloadable reports will appear here only when their underlying evidence is ready for publication.
REPORT PIPELINE
CURRENT STATUS
Sustainable Oasis already has an online reporting architecture connected to Research, Control Room, Projects and Knowledge.
Downloadable PDF or data-backed report packages will be released only after the associated reporting content is sufficiently complete.
No empty report files are being presented as finished publications.
REPORT LIBRARY
Each report type answers a different question about Sustainable Oasis performance.
Questions, hypotheses, procedures, measurements, results and conclusions.
Experiment Reports →System output, efficiency, reliability, resource use and operating behavior.
Performance Reports →Resource protection, recovery, waste reduction and resilience indicators.
Sustainability Reports →Future year-by-year summary of projects, research, impact and economic development.
Annual Reports →REPORT STANDARD
What was being investigated or evaluated?
What was included and excluded?
How were observations and measurements produced?
Which raw or derived data supports the result?
What does the evidence actually support?
EVIDENCE CLASSIFICATION
Example values used only for explanation or interface testing.
DEMOValues produced from assumptions or planning models.
ESTIMATEDValues recorded from physical systems or field observations.
MEASUREDValues calculated from documented source measurements.
DERIVEDEXPERIMENT REPORTS
A Sustainable Oasis experiment report should preserve the original question, hypothesis, variables, instrumentation, procedure and raw data.
It should then state what the result supports without turning an interesting observation into a stronger conclusion than the evidence allows.
RESULT STATUS
The observations are consistent with the tested hypothesis within the experiment boundary.
The observed result does not support the tested hypothesis.
The available evidence is not sufficient to decide reliably.
The result should be repeated before a stronger conclusion is made.
PERFORMANCE REPORTS
Performance reporting can compare system inputs, useful outputs, losses and operating conditions.
A performance report should retain units, time period and system boundary so comparisons remain meaningful.
ENERGY REPORTING
Sustainable Oasis energy reporting uses:
ENERGY IN = USEFUL OUTPUT + STORAGE CHANGE + LOSSES
Auxiliary loads, converters, pumps, motors, chargers, controls and storage changes should be included when they belong inside the experimental boundary.
Recovered energy reduces waste. It does not represent newly created energy.
WATER REPORTING
Water reports can document supply, storage, demand, recovery, reuse and loss.
Recovered water should not be double-counted as a new external source.
FOOD REPORTING
A harvest total alone does not describe the performance of a food system.
Sustainable Oasis food reporting can compare harvest, growing area, water, energy, duration and repeatability.
SUSTAINABILITY REPORTS
Sustainability reporting can compare resource use before and after a documented intervention.
Baselines matter because improvement requires something meaningful to compare against.
DEFINE THE BASELINE
Before claiming reduced energy use, reduced water demand, higher food productivity or better system performance, Sustainable Oasis should define what existed before the change.
Baseline and post-change measurements should be as comparable as practical.
FUTURE ANNUAL REPORT
A future Sustainable Oasis annual report can bring research, projects, impact and economic development into one documented review.
Experiments completed, results and new questions.
Infrastructure built, improved or tested.
Measured changes in resource use and resilience.
Revenue, costs and reinvestment where documented.
Guides, blueprints, datasets and publications created.
Open questions, priorities and future tests.
REPORTS BY PROJECT
Prototype tests, instrumentation, failures and measured improvements.
Garage Lab →Modular infrastructure, equipment integration and future performance reports.
Container Workshop →Field observations involving terrain, water, growing and renewable systems.
Vietnam Oasis →Future mobile energy, infrastructure and operating reports.
Mobile Oasis →Future cross-system reporting across energy, water, food, infrastructure and impact.
Complete Oasis →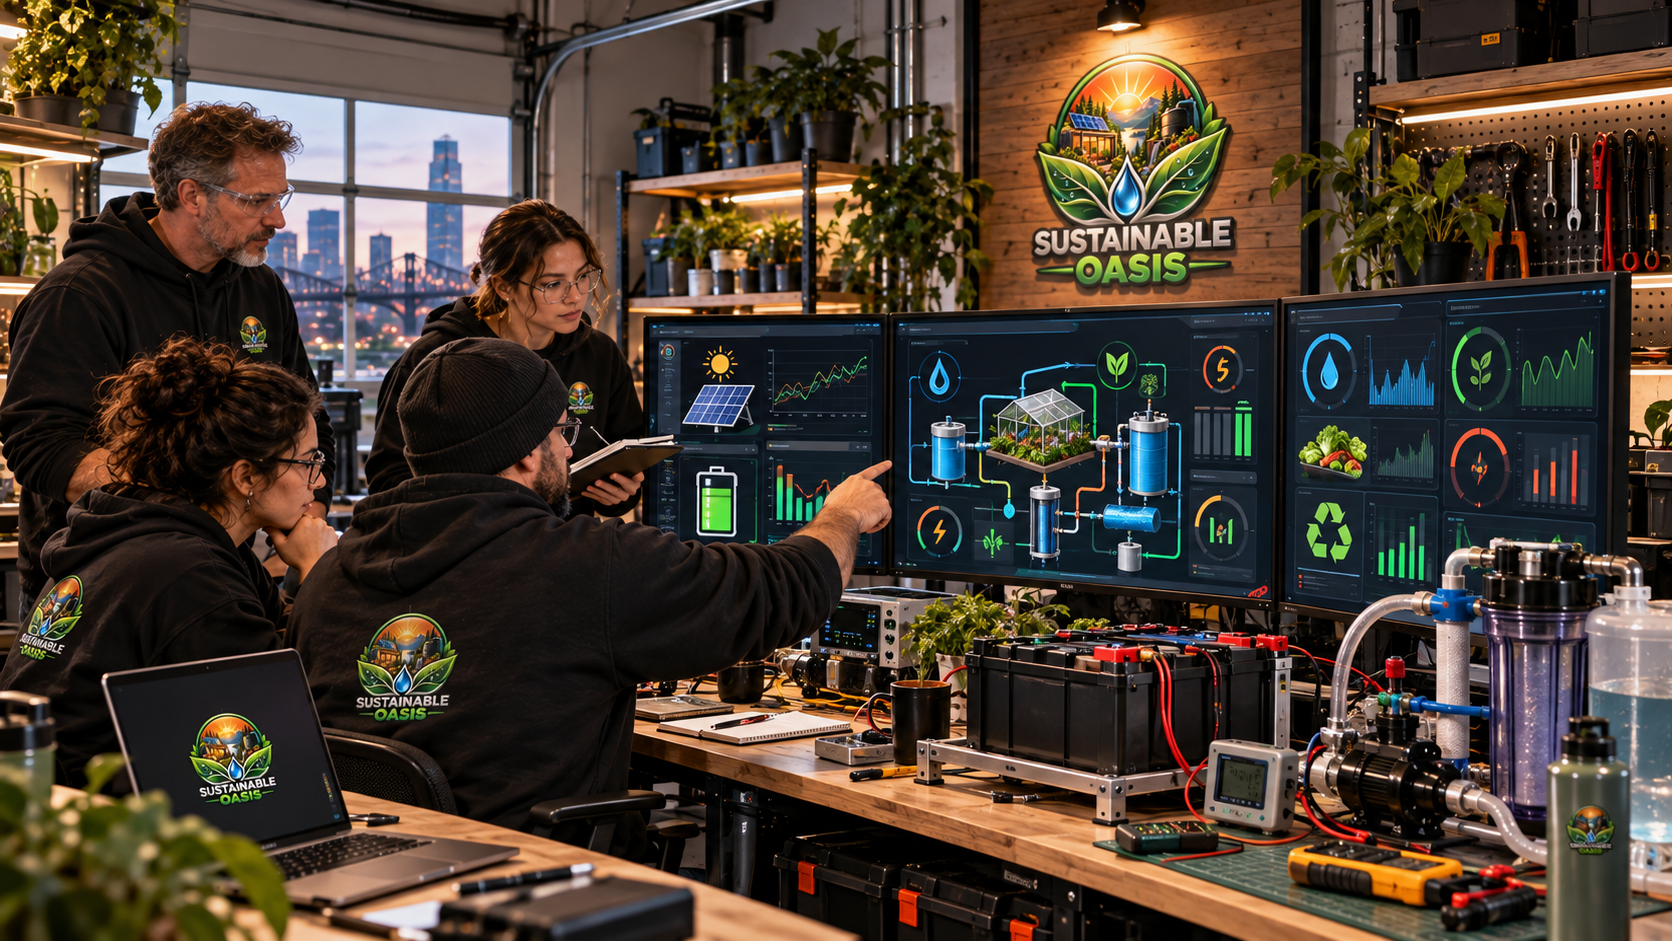
SO-EMS REPORTING
SO-EMS provides the energy-measurement foundation needed to compare inputs, outputs, storage changes and recovery.
Reports can then use the recorded data without losing the measurement boundary behind the result.
REPORTS + DATASETS
Future downloadable reports should link to supporting datasets whenever publishing the data is practical.
This makes it easier to distinguish the original measurement from the interpretation built from it.
REPORTS + CONTROL ROOM
The Sustainable Oasis Control Room organizes current resource information.
Reports provide deeper analysis of selected periods, experiments or project milestones.
REPORTS + KNOWLEDGE
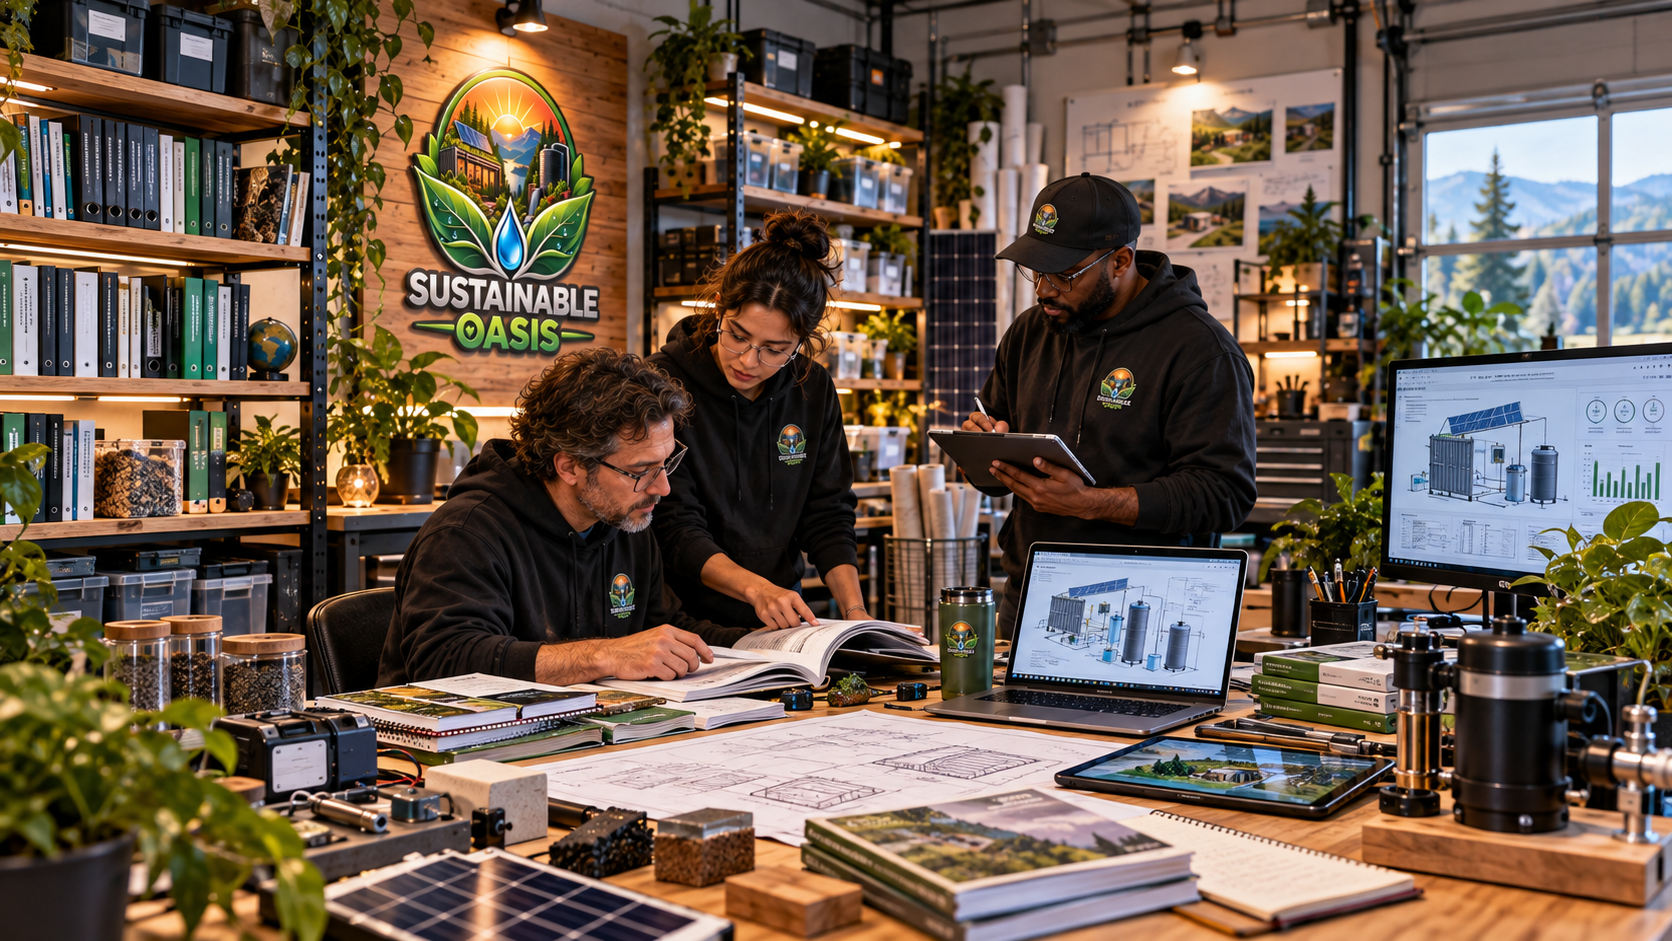
A report can later become a case study, field note, guide or blueprint.
This allows Sustainable Oasis to preserve not only what worked, but why it worked and under what conditions.
REPORT VERSIONING
Unique identifier for the report.
Document revision and release state.
When the report was issued.
Which time period the report represents.
Which measurements, datasets or records support it.
Important uncertainty, exclusions and caveats.
REPORT FAILURES TOO
If a hypothesis is not supported, that result still contains information.
Sustainable Oasis reporting should preserve failed and inconclusive tests when they can prevent repetition of the same mistake.
Transparent negative results are part of useful research.
FUTURE DOWNLOAD FORMATS
Portable publication for reading and archiving.
PLANNEDLiving online version connected to current site resources.
AVAILABLEMachine-readable measurements where publication is appropriate.
PLANNEDMachine-readable report and dataset context.
PLANNEDREPORT SAFETY
Electrical systems, batteries, potable water, structural work, pressure systems, machinery and other regulated work can require qualified expertise.
Reports should preserve relevant operating limitations and safety context whenever physical reproduction may be considered.
COMPLETE OASIS REPORTING
The Complete Oasis reporting model can connect physical resources, system condition, impact and economic performance.
REPORTING PRINCIPLES
Link conclusions to their source evidence.
Distinguish measured, estimated and derived values.
Include important inputs, outputs and system boundaries.
Preserve failures, uncertainty and unfavorable results.
Turn evidence into a better next decision.
MASTER REPORT PIPELINE
DOWNLOAD LIBRARY
Experimental and field measurement packages.
Datasets →Practical reusable instructions and educational resources.
Guides →Future blueprints, diagrams and build packages.
Plans →Research, performance and sustainability reporting.
Reports →Experiment sheets, checklists and planning templates.
Worksheets →SUSTAINABLE OASIS REPORTS