What did the test show?
Research questions, hypotheses, methods, raw data, analysis, conclusions and replication needs.
Experiment Reports →SUSTAINABLE OASIS REPORTS
Sustainable Oasis reports turn measurements, experiments, field observations and project history into structured records.
A report should explain what happened, how we know, what remains uncertain and what should happen next.
Reports are not written to make every project look successful.
They are written to make every future decision stronger.
REPORTING PHILOSOPHY
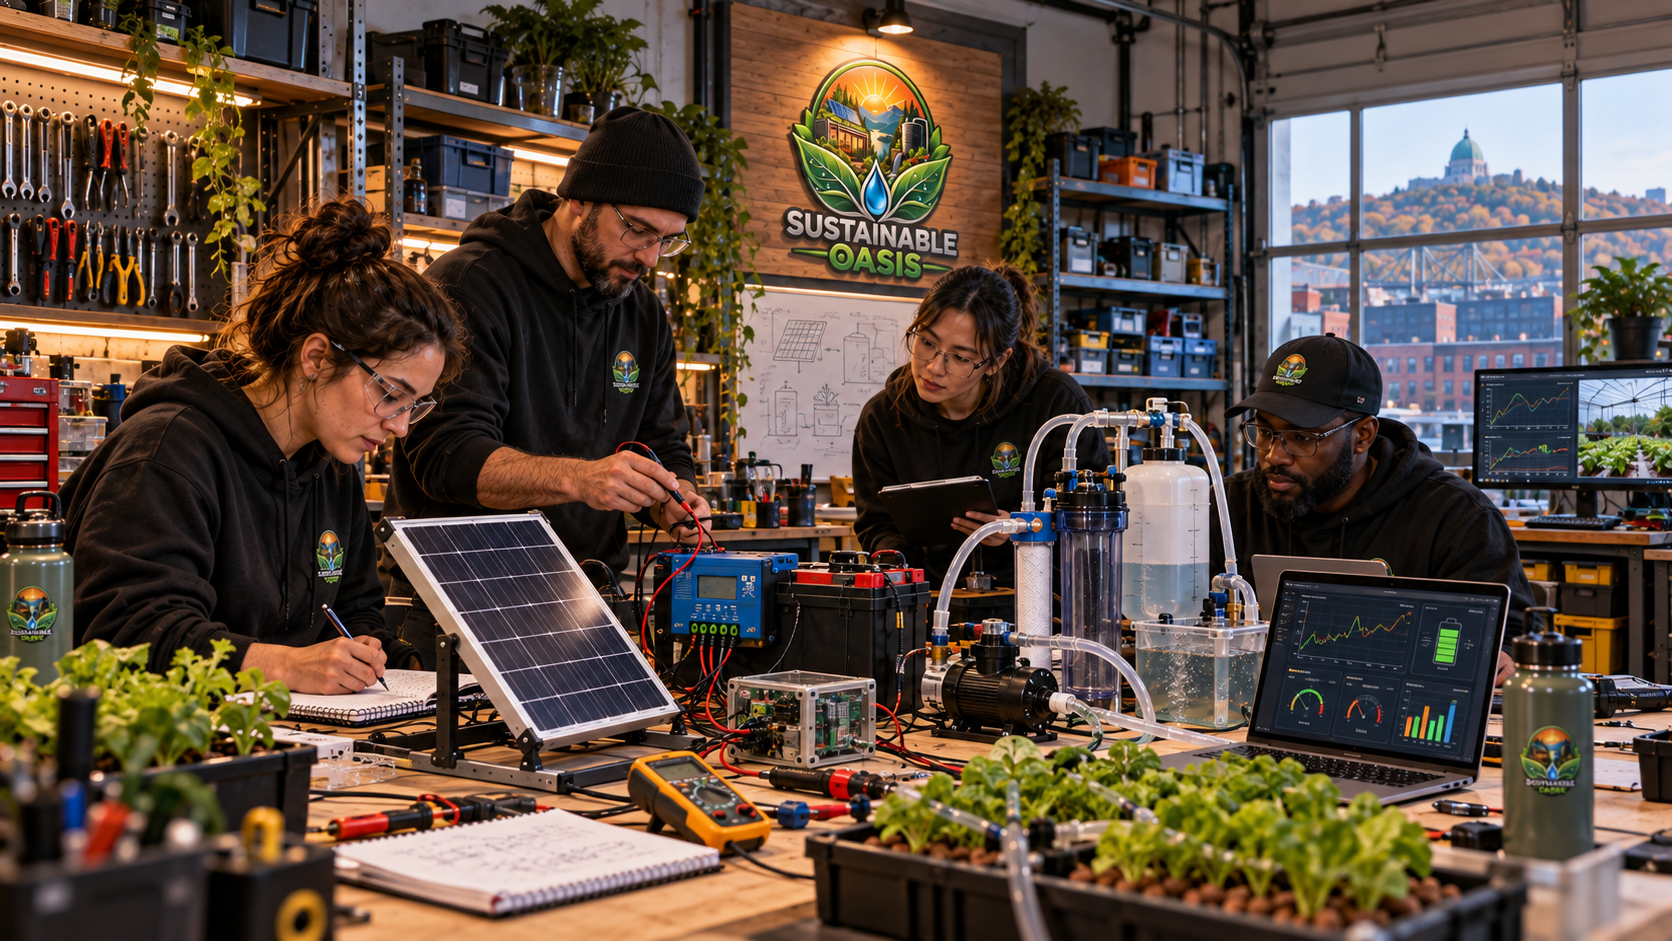
Sustainable Oasis reports should distinguish clearly between observations, measurements, calculations, estimates and interpretation.
A strong report can document success, failure, partial success, uncertainty or an inconclusive result.
The objective is not to create perfect stories.
The objective is to preserve useful truth.
REPORTING PIPELINE
REPORT LIBRARY
Each report type answers a different question about Sustainable Oasis.
Research questions, hypotheses, methods, raw data, analysis, conclusions and replication needs.
Experiment Reports →Inputs, outputs, efficiency, losses, resource use and operational behavior.
Performance Reports →Resource demand, recovery, waste reduction, resilience and baseline comparison.
Sustainability Reports →Projects, research, infrastructure, impact, economics and knowledge produced.
Annual Report →REPORT STANDARD
Define the problem, objective or performance question.
Define which inputs, outputs and systems are included.
Explain how the information was collected.
Preserve measurements, observations and supporting records.
State only what the available evidence supports.
DATA CLASSIFICATION
Example values used for interfaces or education.
DEMOValues based on assumptions, planning or models.
ESTIMATEDValues recorded from physical systems or documented observations.
MEASUREDCalculations produced from documented source data.
DERIVEDEXPERIMENT REPORTS
Experiment reports document the research question, hypothesis, system boundary, variables, instrumentation, procedure, raw data and conclusion.
They should also preserve failed tests, unexpected observations and known limitations.
EXPERIMENT RESULT STATES
Evidence supports the hypothesis inside the defined boundary.
Evidence does not support the hypothesis.
Evidence is insufficient for a reliable conclusion.
Additional testing is needed before stronger claims.
PERFORMANCE REPORTS
Performance reporting connects inputs, useful outputs, storage changes, losses and operating conditions.
Efficiency numbers should never appear without a clearly defined boundary.
Different operating conditions may produce different results.
ENERGY REPORTING
Energy reports should include all meaningful generation, consumption, recovery, auxiliary loads and storage changes.
ENERGY IN = USEFUL OUTPUT + STORAGE CHANGE + LOSSES
Recovery reduces waste. It does not create new energy outside the system boundary.
WATER REPORTING
Water reports can document collection, external supply, storage, flow, pumping, consumption, recovery and appropriate reuse.
Recovered water should not be counted as new external supply.
Keeping the water balance clear helps quantify autonomy, demand and system losses.
FOOD REPORTING
Food-production reports can combine harvest, growing area, water use, energy demand, crop duration and operating conditions.
This allows different growing methods to be compared more fairly.
PRODUCTIVITY = HARVEST ÷ GROWING AREA
SUSTAINABILITY REPORTS
Sustainability reports can compare documented resource demand and system performance over time.
Useful indicators may include energy demand, freshwater demand, recovery, waste, food productivity and resilience.
When no reliable baseline exists, the report should say so.
BASELINE DISCIPLINE
Reports should preserve the reference period, system boundary, measurement method, units and operating conditions used for comparison.
Without comparable baseline data, the correct report may simply describe current performance.
ANNUAL REPORT
The annual report can combine project progress, research, resource performance, infrastructure, sustainability, economics and knowledge production.
It should also preserve failures, delayed work and priorities for the year ahead.
The 2026 reporting year remains in progress, so no final year-end totals are being claimed yet.
REPORT BY PROJECT
Experimental reports, instrumentation, prototypes and controlled tests.
Garage Lab →Infrastructure reports, installation lessons, maintenance and modular-system performance.
Container Workshop →Field reports covering water, terrain, food, energy and site conditions.
Vietnam Oasis →Future engineering reports covering mobility, energy, terrain and deployable infrastructure.
Mobile Oasis →Integrated reports combining energy, water, food, infrastructure, impact and economics.
Complete Oasis →SO-EMS REPORTING
The Sustainable Oasis Energy Management System provides the measurement framework for tracking energy through experimental systems.
SO-EMS reports can preserve input energy, useful output, recovery, storage changes and losses.
This helps prevent storage depletion or unmeasured auxiliary inputs from being mistaken for new energy production.
REPORTS + DATASETS
CONTROL ROOM → REPORTS
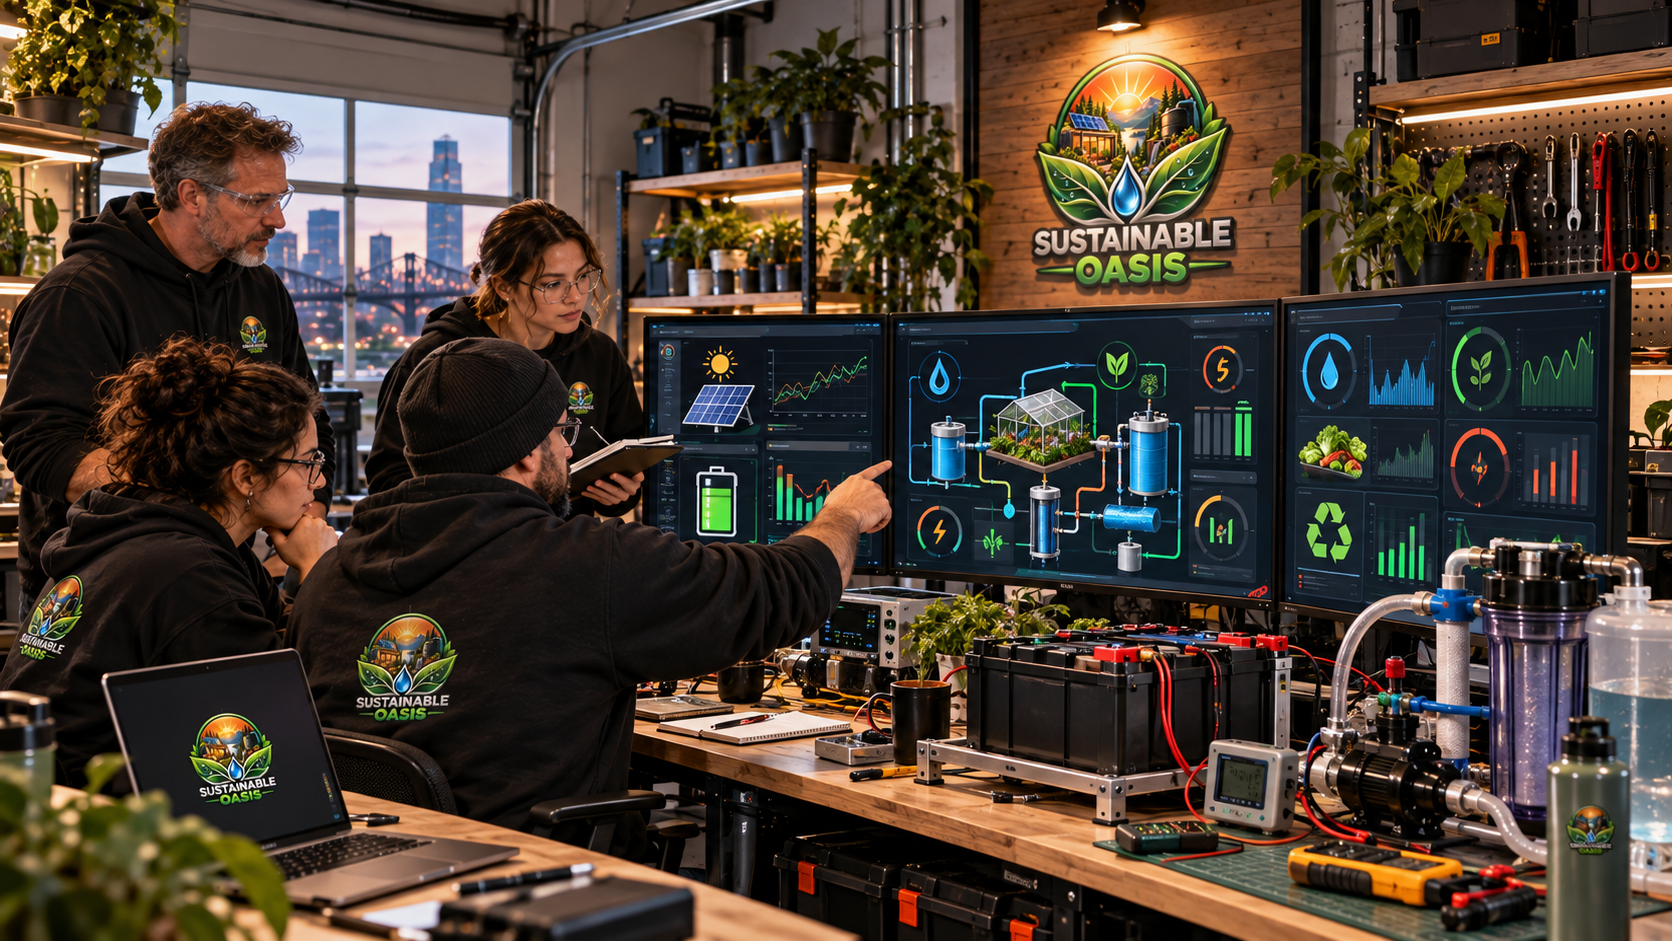
The Sustainable Oasis Control Room can help organize energy, water, food, infrastructure, impact and economic information.
Reports should grow from records collected during operation rather than from memory alone.
The Control Room helps preserve context before the reporting stage begins.
REPORTS → KNOWLEDGE
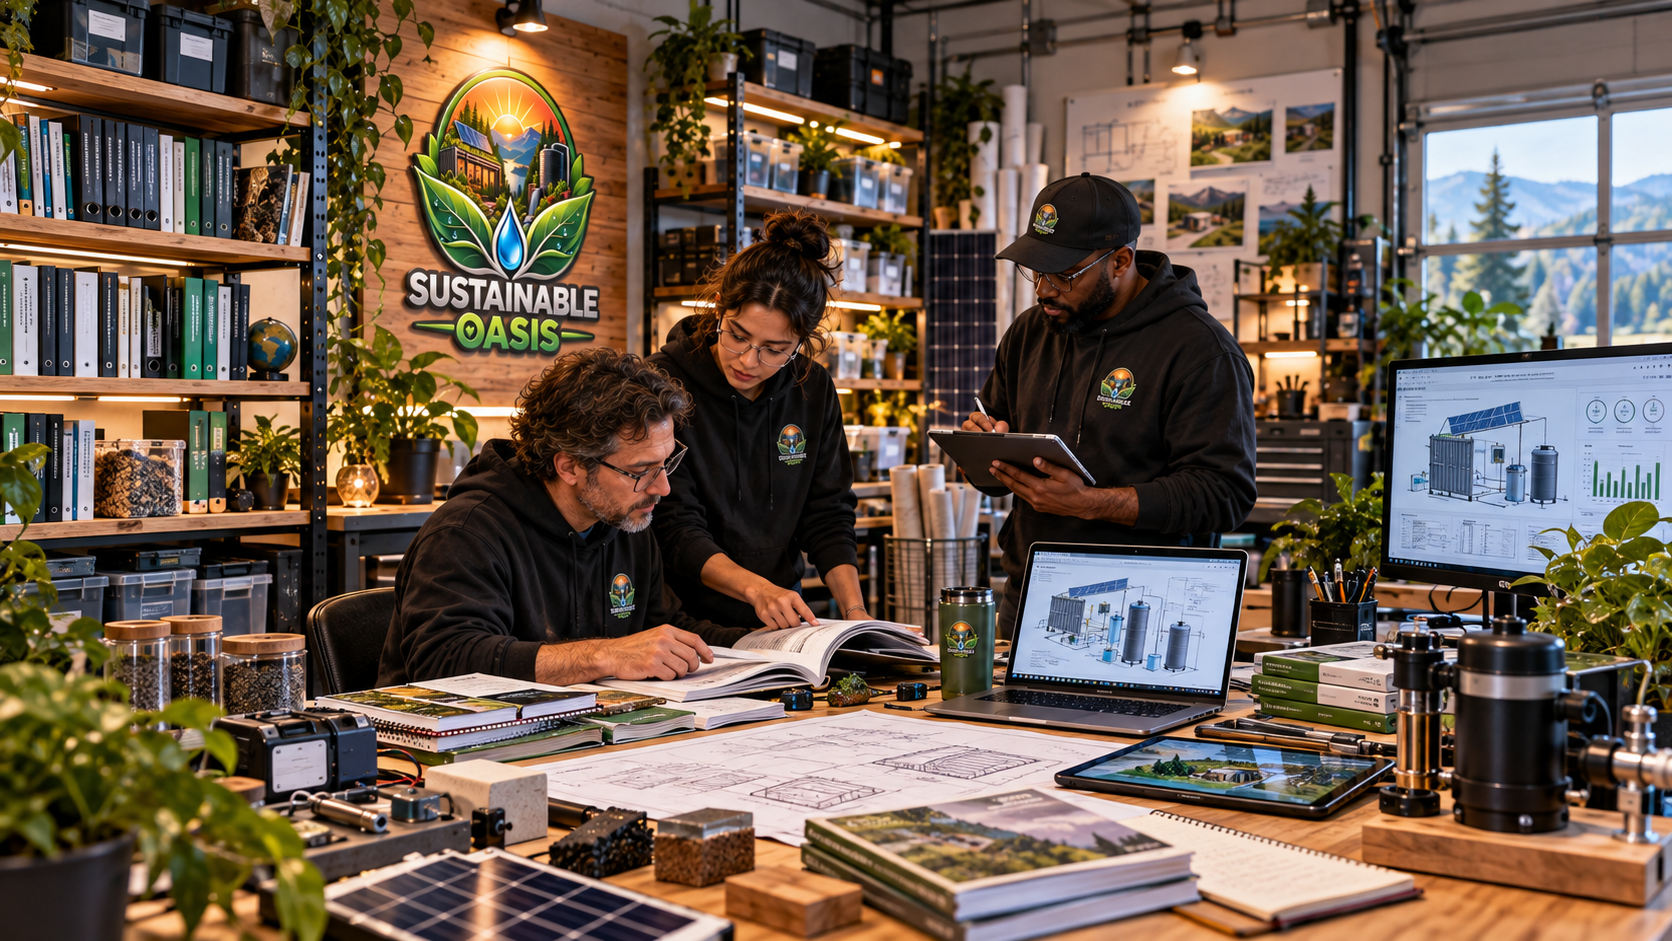
Mature reports can become the source for field notes, guides, blueprints, case studies and educational material.
Reports preserve the complete evidence.
The Knowledge Base turns those findings into reusable information.
KNOWLEDGE PIPELINE
PRESERVE FAILURE
Reports should preserve failed tests, abandoned designs, unexpected losses, maintenance problems and inconclusive results.
Removing these records creates a false history and increases the chance of repeating the same mistakes.
Sustainable Oasis should treat useful failure as part of its knowledge system.
REPORT LIMITATIONS
Identify measurements that were not available.
Preserve accuracy, resolution and calibration limitations.
Note changing conditions that may influence results.
State when additional trials are still required.
Avoid extending conclusions beyond the tested system.
REPORT VERSIONING
Permanent reference for the report.
Identify each published revision.
Record when the version was released.
Define exactly which period the report covers.
Connect key conclusions to supporting evidence.
Preserve important uncertainty and exclusions.
DOWNLOADABLE REPORTS
The online reporting architecture can remain the current source while reports are still developing.
Future validated reports may be published as downloadable PDFs with supporting datasets, worksheets or source records.
Empty or fictional report files should not be presented as completed publications.
COMPLETE OASIS REPORTING
REPORTING PRINCIPLES
Important claims should connect to evidence.
Preserve assumptions, boundaries and methods.
Include meaningful inputs, outputs and losses.
Preserve uncertainty, failures and limitations.
Convert reporting into better future decisions.
OUR NORTH STAR
Sustainable Oasis reports should eventually help answer:
What did we consume? What did we produce? What did we recover? What failed? What improved? What became more resilient?
And most importantly: what should we build differently next?
IN THE FUTURE, SUCCESS WILL NOT BE MEASURED BY WHAT WE HAVE, BUT BY WHAT WE PROTECT.
REPORT DIRECTORY
Questions, methods, evidence, results and replication.
Experiment Reports →Inputs, outputs, losses, efficiency and system behavior.
Performance Reports →Resource demand, impact, resilience and baseline comparison.
Sustainability Reports →Yearly progress across research, projects, impact, economics and knowledge.
Annual Report →REPORTING LEARNING LOOP
SUSTAINABLE OASIS REPORTS