
Energy Stewardship
Generation, demand, storage, recovery, efficiency and losses.
Energy Reporting →REPORTS — SUSTAINABILITY
Sustainable Oasis Sustainability Reports connect technical performance with resource stewardship.
They are designed to examine energy demand, water demand, food production, waste, recovery, resilience and the condition of the systems supporting each Oasis.
A sustainability claim becomes stronger when it can be compared against a documented baseline using clear system boundaries.
SUSTAINABILITY PRINCIPLE
Installing renewable technology does not automatically make an entire system sustainable.
Sustainable Oasis should examine the complete operating system: what resources enter, what services are created, what is wasted, what can be recovered and how long the infrastructure can continue to function.
The objective is measurable improvement, not a perfect sustainability claim.
SUSTAINABILITY FRAMEWORK
SUSTAINABILITY DOMAINS
Generation, demand, storage, recovery, efficiency and losses.
Energy Reporting →Capture, storage, consumption, treatment, recovery and reuse.
Water Reporting →Harvest, growing area, water, energy and productivity.
Food Reporting →Prevent, repair, reuse, recover and reduce residual waste.
Waste Reporting →Reserves, autonomy, backup paths, manual control and failure modes.
Resilience Reporting →Durability, maintenance, repairability and service life.
Infrastructure Reporting →BASELINE FIRST
Before Sustainable Oasis claims that a system reduced demand or improved sustainability, the original condition should be understood.
A useful baseline defines the reporting period, system boundary, resource demand and operating conditions.
When no reliable baseline exists, the correct first step is to establish one.
COMPARABLE CONDITIONS
Energy or water use may decrease because production, occupancy or operating time also decreased.
Sustainability reports should therefore preserve enough operating context to distinguish efficiency improvements from changes in activity.
Comparable units, time periods and system boundaries make the result more meaningful.
SUSTAINABILITY DATA CLASSIFICATION
Example values used for interfaces or education.
DEMOModeled values produced from documented assumptions.
ESTIMATEDValues physically recorded from the system or field site.
MEASUREDCalculations produced from documented source information.
DERIVEDENERGY SUSTAINABILITY
Renewable generation is important, but sustainability reporting should also examine energy conservation and demand reduction.
Sustainable Oasis can measure generation, external supply, consumption, recovery, storage changes and documented losses.
Lower demand can reduce the generation, battery capacity and infrastructure required to maintain resilience.
ENERGY CONSERVATION
Sustainable Oasis sustainability reporting should retain the complete energy accounting boundary.
ENERGY IN = USEFUL OUTPUT + STORAGE CHANGE + LOSSES
Regenerative systems, micro-hydro recovery and other recovery methods may improve overall efficiency.
Recovered energy should not be double-counted as a new external source.
WATER SUSTAINABILITY
Sustainable Oasis water reporting can distinguish external supply, rainwater capture, groundwater, storage, consumption and recovered water.
Recovered water should remain separate from new water entering the system boundary.
This makes changes in freshwater dependence easier to understand.
WATER STEWARDSHIP LOOP
WATER QUALITY
Reuse systems should match water quality to the intended use.
Water intended for drinking requires appropriate treatment, testing and applicable regulatory compliance.
Sustainability reporting should never treat unsafe water reuse as resource improvement.
FOOD SUSTAINABILITY
Food sustainability is not simply the amount harvested.
Sustainable Oasis can compare production against growing area, water demand, energy demand and time.
This helps identify growing systems that deserve to expand and those that need improvement.
PRODUCTIVITY
A simple productivity measure can help compare growing approaches:
PRODUCTIVITY = HARVEST KG ÷ GROWING AREA M²
Water, energy, crop duration and growing conditions should remain visible alongside productivity.
WASTE + MATERIAL STEWARDSHIP
Material demand eliminated through better design.
Assets kept in service instead of replaced.
Materials or components used again without disposal.
Material or resource recovered from an existing waste stream.
Material remaining after prevention, reuse and recovery.
CIRCULARITY
Reusing energy, water or materials can reduce waste.
But every recovery process can also require energy, equipment, maintenance or treatment.
Sustainable Oasis should measure both the recovered resource and the resources required to recover it.
RESILIENCE
A highly efficient system may still be fragile if one failure removes an essential service.
Sustainable Oasis resilience reporting can examine essential demand, reserves, autonomy windows, failure modes, backup paths and manual operation.
Resilience should be evaluated by system category rather than reduced to one unexplained score.
RESILIENCE QUESTIONS
What service must remain available?
What minimum resource does that service require?
What stored resource is available?
What can interrupt the service?
What alternative remains when the primary path fails?
INFRASTRUCTURE SUSTAINABILITY
Replacing equipment frequently can consume materials, capital and labor.
Sustainable Oasis infrastructure should therefore consider durability, maintenance access, repairability, replaceable components and documented service history.
A system designed for maintenance may create more long-term value than a system optimized only for initial installation.
AUTOMATION + SUSTAINABILITY
Sensors and local controls may help reduce unnecessary pumping, lighting, heating, cooling or water use.
But automation also introduces electronics, standby energy, maintenance and failure modes.
Sustainability reporting should therefore evaluate whether automation actually creates a net operational benefit.
LOCAL RESILIENCE
Remote visibility can be useful, but essential water, energy and safety functions should retain practical local operation where appropriate.
Manual override and safe failure states are part of resilient design.
ECONOMIC SUSTAINABILITY
Sustainable Oasis projects require materials, replacement parts, maintenance, labor and capital.
Economic sustainability therefore belongs alongside resource sustainability.
Revenue projections should remain separate from actual revenue received, just as modeled performance remains separate from measured performance.
CAPITAL DISCIPLINE
Large infrastructure commitments can reduce resilience if they consume the resources needed to maintain operations.
Sustainable Oasis should let proven economic activity help finance future land, infrastructure and research development.
SUSTAINABILITY BY PROJECT
Test resource-saving concepts before scaling into larger infrastructure.
Garage Lab →Study compact systems, repairability, material use and modular infrastructure.
Container Workshop →Study water, food, terrain, renewable energy and field resilience.
Vietnam Oasis →Explore compact, transportable and resource-efficient infrastructure.
Mobile Oasis →Bring resource systems together into one measurable stewardship model.
Complete Oasis →COMPLETE OASIS SUSTAINABILITY
CONTROL ROOM → SUSTAINABILITY
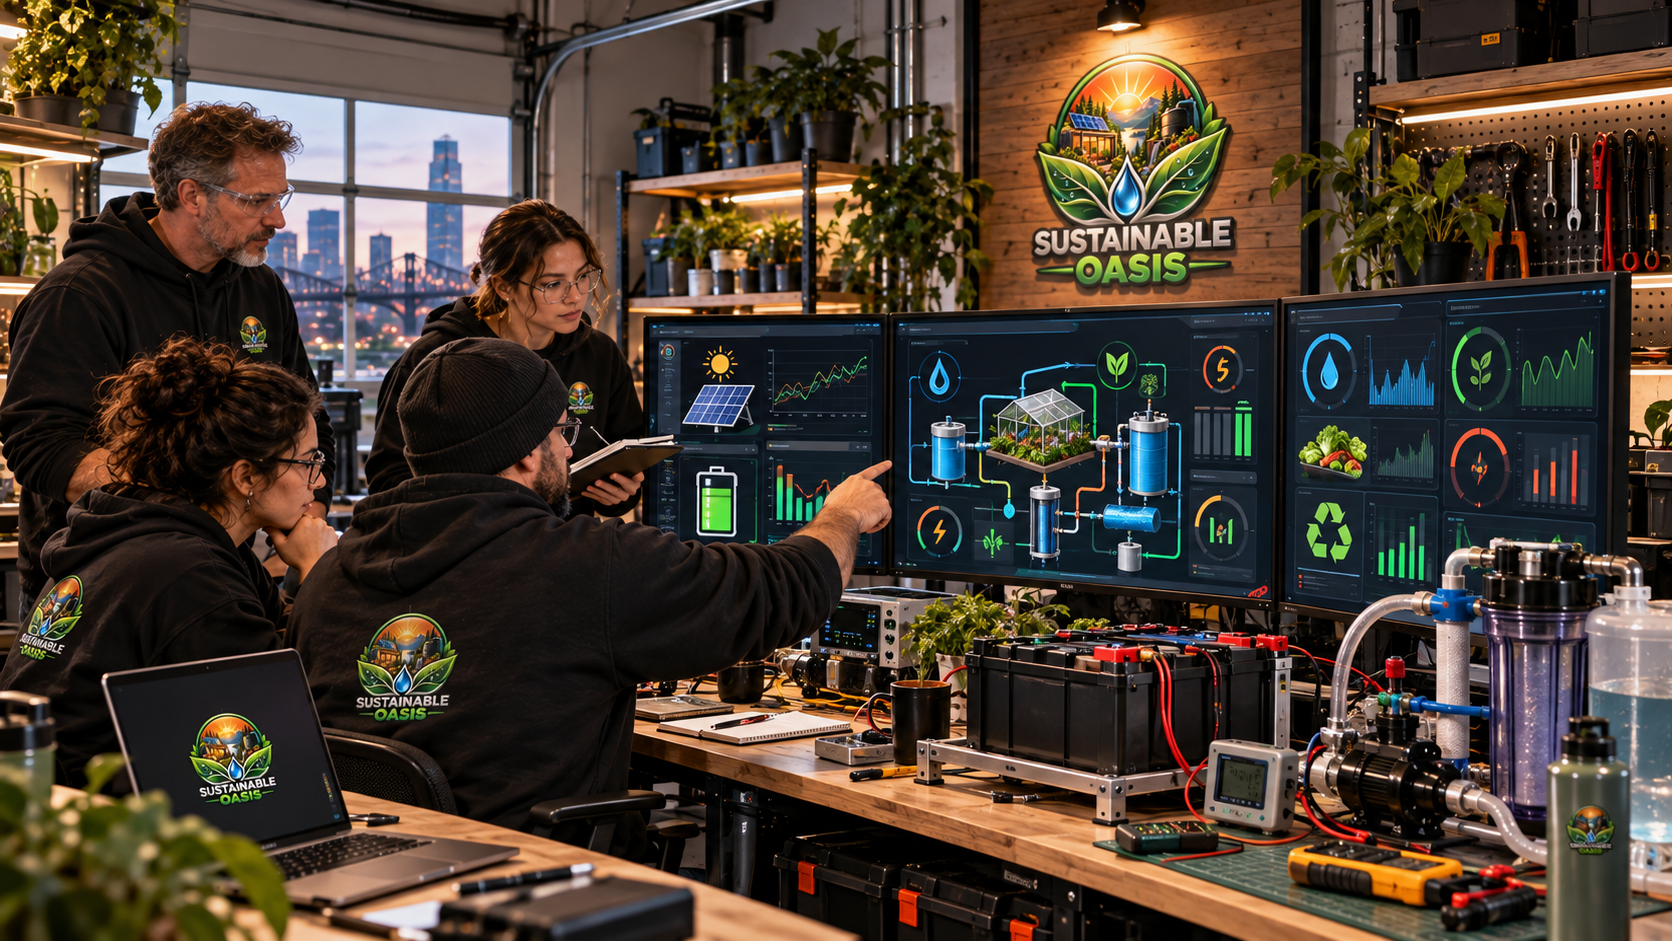
The Sustainable Oasis Control Room can organize energy, water, food, infrastructure, impact and economic records.
Sustainability reports can eventually draw from verified operational information rather than retrospective assumptions.
No dashboard value should be presented as a real measurement unless a real measurement supports it.
IMPACT DATA PIPELINE
LIMITATIONS
Sustainable Oasis may not initially have complete information for every environmental impact.
A report may contain strong operational measurements while lacking full life-cycle, embodied-material or supply-chain analysis.
Those limitations should be stated openly rather than hidden behind a broad sustainability label.
REPORTING SCOPE
One pump, battery, filter or other device.
An energy, water, food or automation system.
A Garage Lab, Container, field or mobile site.
Combined resource and infrastructure performance.
Future analysis may extend into materials, replacement and embodied impacts.
TIME MATTERS
Short controlled tests reveal immediate behavior.
Shows demand and resource cycles.
Captures climate and production variation.
Reveals broader resource performance.
Reveals durability, maintenance and long-term trends.
LAB → FIELD
Field performance can differ because of weather, terrain, water quality, maintenance, human behavior and seasonal changes.
Sustainable Oasis should therefore distinguish controlled-test results from field sustainability results.
Vietnam Oasis and future physical sites can help expose conditions that bench testing cannot.
PRESERVE NEGATIVE RESULTS
Some sustainability ideas may perform worse than expected.
A recovery system may consume more energy than the recovered resource justifies.
A highly automated system may introduce unnecessary complexity or maintenance.
Sustainable Oasis should preserve those results so future designs can avoid repeating them.
SUSTAINABILITY REPORT VERSIONING
Permanent reference for the report.
Identify the current publication revision.
Define exactly which dates the report represents.
Preserve the comparison reference used.
Connect impact claims to supporting records.
Preserve uncertainty, exclusions and missing evidence.
SUSTAINABILITY → KNOWLEDGE
Mature sustainability reports can become case studies, design principles, guides, planning tools and better future blueprints.
A documented water-saving improvement can inform the next water system.
A documented failure can protect future projects from repeating the same resource cost.
STEWARDSHIP KNOWLEDGE PIPELINE
FUTURE SUSTAINABILITY DOWNLOADS
Future Sustainability Reports may be released as versioned PDF documents with supporting datasets, worksheets and baseline records.
Until real evidence packages are complete, Sustainable Oasis should not present fictional downloadable reports.
SUSTAINABILITY REPORT PRINCIPLES
Know where the system started.
Avoid unnecessary resource use before adding capacity.
Preserve complete resource accounting.
Extend useful life through serviceable systems.
State what the report does not yet prove.
OUR NORTH STAR
Sustainable Oasis should measure progress through better stewardship, stronger resilience, lower unnecessary demand, useful recovery and knowledge that can help the next project.
Our reports should eventually help answer one question with increasing clarity:
ARE WE PROTECTING MORE BECAUSE THIS OASIS EXISTS?
IN THE FUTURE, SUCCESS WILL NOT BE MEASURED BY WHAT WE HAVE, BUT BY WHAT WE PROTECT.
SUSTAINABLE OASIS REPORTS
Questions, methods, evidence, results and replication.
Experiment Reports →Inputs, outputs, storage changes, losses and efficiency.
Performance Reports →Resource stewardship, baseline comparison, recovery and resilience.
Sustainability Reports →Yearly progress across projects, research, economics, impact and knowledge.
Annual Report →SUSTAINABILITY LEARNING LOOP
SUSTAINABILITY REPORTS